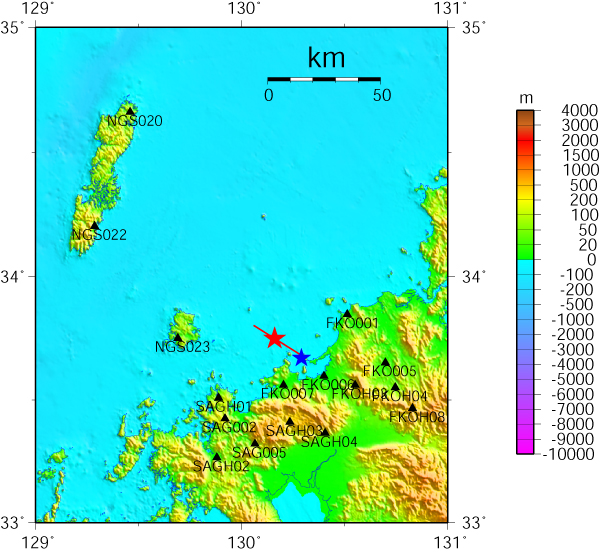
Fig.1:Map showing tations and the epicenter.
Updated on June 1, 2005 (Ver.5)
Updated on May 16, 2005 (Ver.4)
Updated on April 11, 2005 (Ver.3)
Updated on March 22, 2005 (Ver.2)
Japanese Version
We estimated a source model of the 2005 West Off Fukuoka Prefecture earthquake, which is occured in Kyushu, Japan, at 10:53 (JST) on March 20, 2005.
Source rupture process was estimated by the linear waveform inversion using multi time-windows (Sekiguchi et al., 2000). Following Sekiguchi et al.(2000), rake angle constraint and spatio-temopral smoothing were introduced. Appropriate smoothing strength was determined referring ABIC. The Green's functions between the source and stations were calculated by the discrete wavenumber method (Bouchon, 1981) and reflection and transmission matrix (Kennett and Kerry, 1979).
Referring the aftershock distribution, we assumed a single fault plane, which has length of 26km and width of 18km. Epicenter (33.75N, 130.16E) was located by the Institute of Seismology and Volcanology, Faculty of Sciences, Kyushu University. The depth of the hypocenter was assumed to be 14km. The strike and dip of the fault plane are 122 deg. and 87 deg, respectively from the F-net moment tensor solution. We divided the fault plane into subfault of 2km x 2km. The slip at each subfault is represented by the 6 time windows, and basis function of each time window is smoothed ramp function. The risetime of one time window is 1.0 s, and time window interval is 0.5 s.
One-dimensional underground structure model was assumed referring Kawase et al. (2003) and logging data by K-NET and KiK-net for superficial layers.
We used 16 stations of K-NET and KiK-net (surface) shown in Fig.1. S-wave portion of three-component velocity waveforms, which were bandpass-filtered between 0.05 - 1.0 Hz (see Fig.3).
Fig.1:Map showing tations and the epicenter.
Fig.2 shows the final slip distribution obtained by the waveform inversion. Fig.3 is the comparison between observed and synthetic waveforms. Fig.4 shows the temporal progression of the rupture. Large slip is observed at south and shallow region. The slip arround the rupture starting point is small. That is similar to the 2000 Tottori-ken Seibu earthquake. The obtained source process shows that the main rupture propagated upward and south direction.
Total seismic moment is 1.15x10¹⁹Nm (MW6.6). Maximum slip and average slip are 3.2m and 0.8m, respectively. The propagation velocity of first time-window rupture front is 2.1km/s (61% of S-wave Velocity at the source).
Synthetic waveforms fit to observed ones fairly well although pulsive waves are not well reproduced at FKO006. Improvement of the velocity model will be needed.
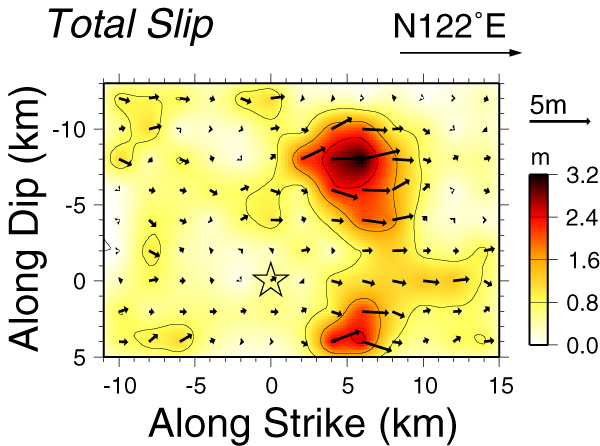
Fig.2:Final slip distribution.
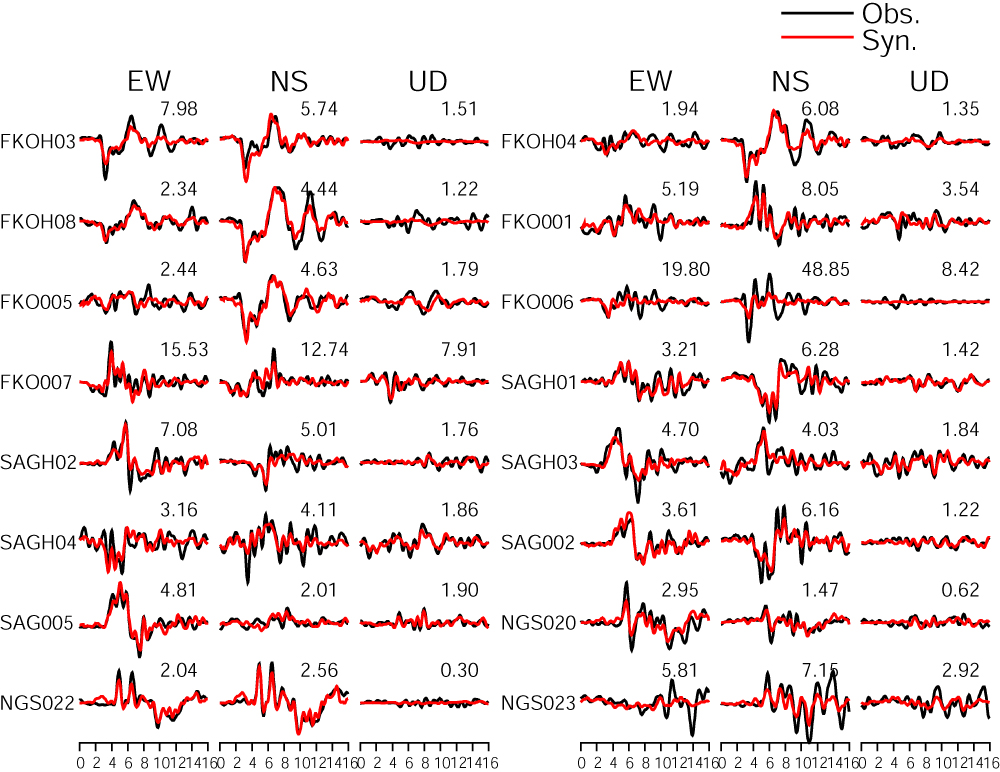
Fig.3:Comparison between observed and synthetic velocity waveforms (0.05-1.0Hz).
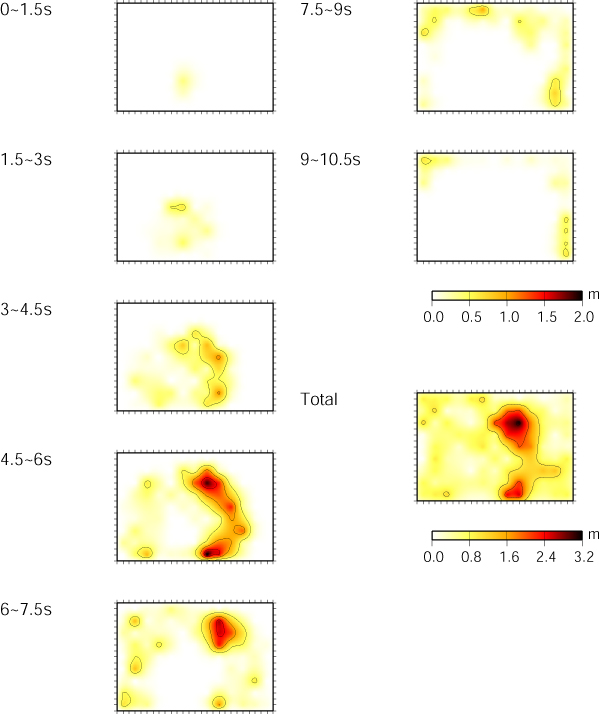
Fig.4:Temoral progression of the rupture.
We estimated the spatial distribution of ground motion by the three-dimensional ground motion simulation using the finite difference method (Pitarka, 1999). We constructed three-dimensional underground structure model referring to the gravity basement map produced by Gravity Map Research Group of the Geological Survey of Japan, AIST. Fig.5 shows the depth of the bedrock (Vs=2.85km/s). Fig.6 shows the spatial distribution of maximum horizontal velocity at surface of the engineering bedrock, where the shear wave velocity is 0.6km/s.
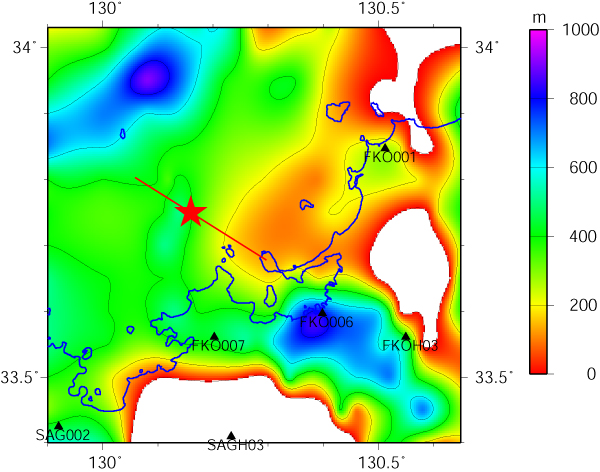
Fig.5:Contour maps showing the depth of the bedrock (Vs=2.85km/s).
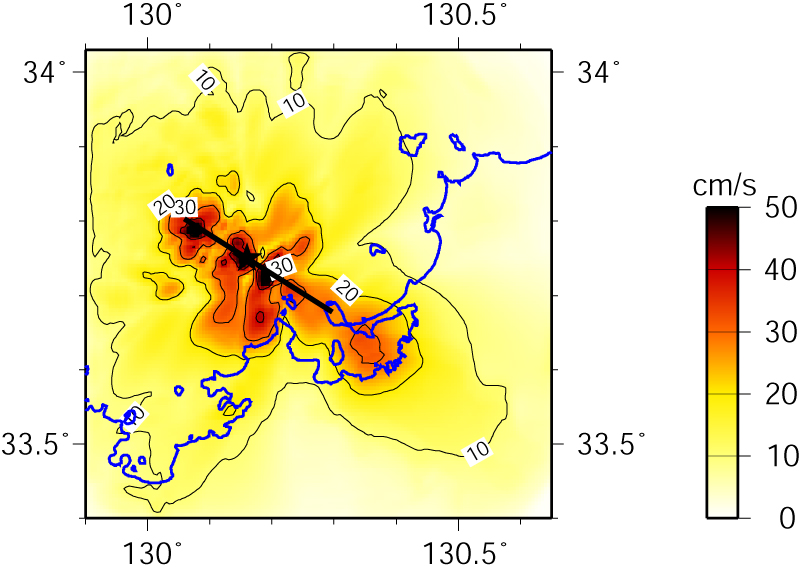
Fig.6:Spatial distribution of maximum horizontal velocity (0.05-1Hz) at the engineering bedrock (Vs=0.6km/s).
We used the strong motion data by K-NET and KiK-net operated by the National Research Institute for Earth Science and Disaster Prevention. We used GMT4.0 to draw the figures.
(Kimiyuki ASANO and Tomotaka IWATA, Disaster Prevention Research Institute, Kyoto University)