(Mainly) Ground Motion Information of the 1999 Chi Chi earthquake
Last updated 99/10/02
goto Japanese version

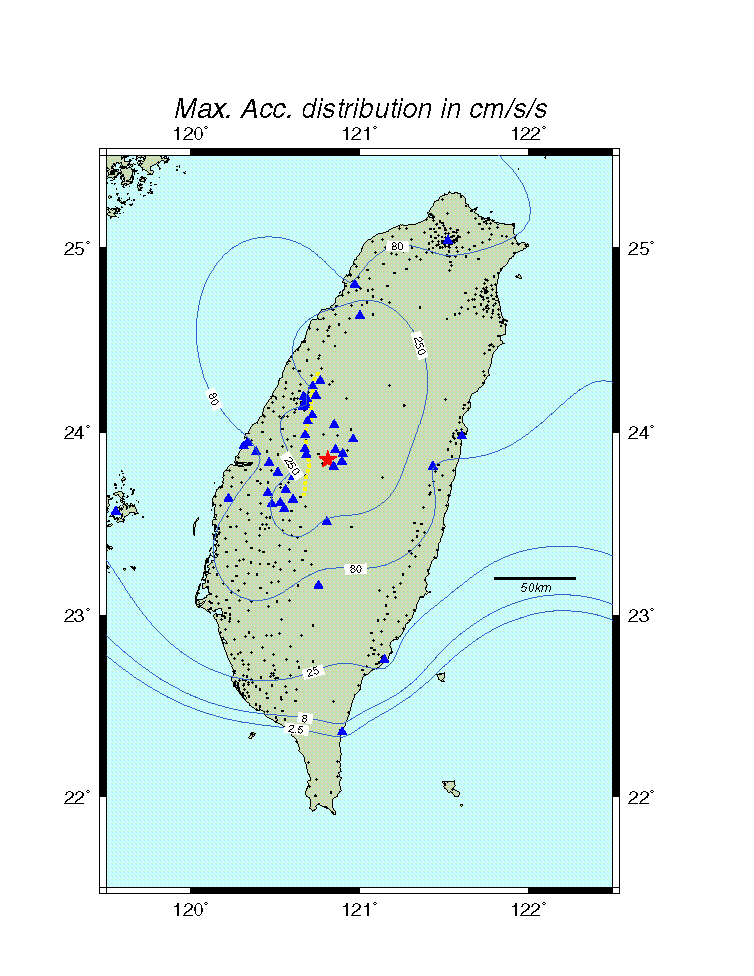
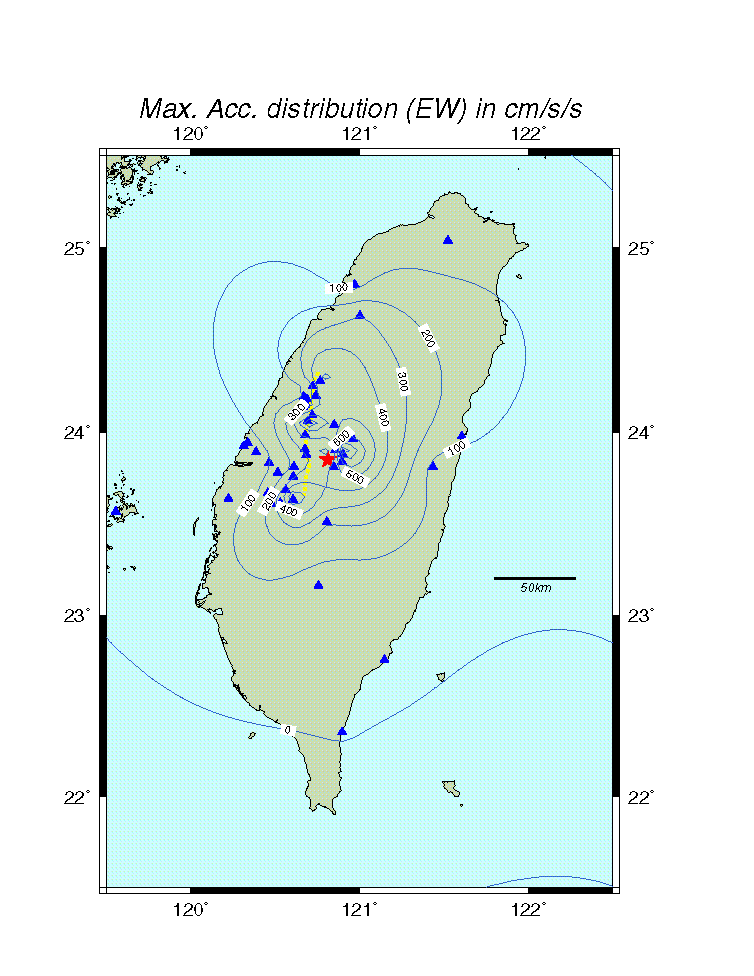
 Distribution of maximum acceleration in near-fault area. Data were released by CWB, Taiwan, and from Prof. J. Mori.
Distribution of maximum acceleration in near-fault area of 42 stations
Maximum velocity distribution
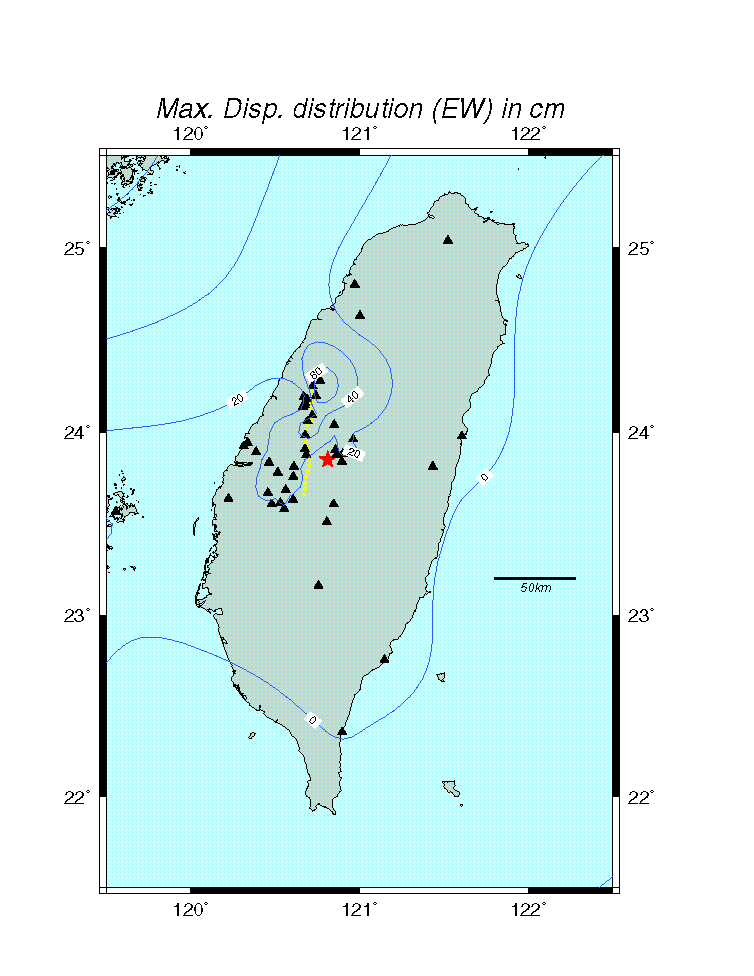
Maximum displacement
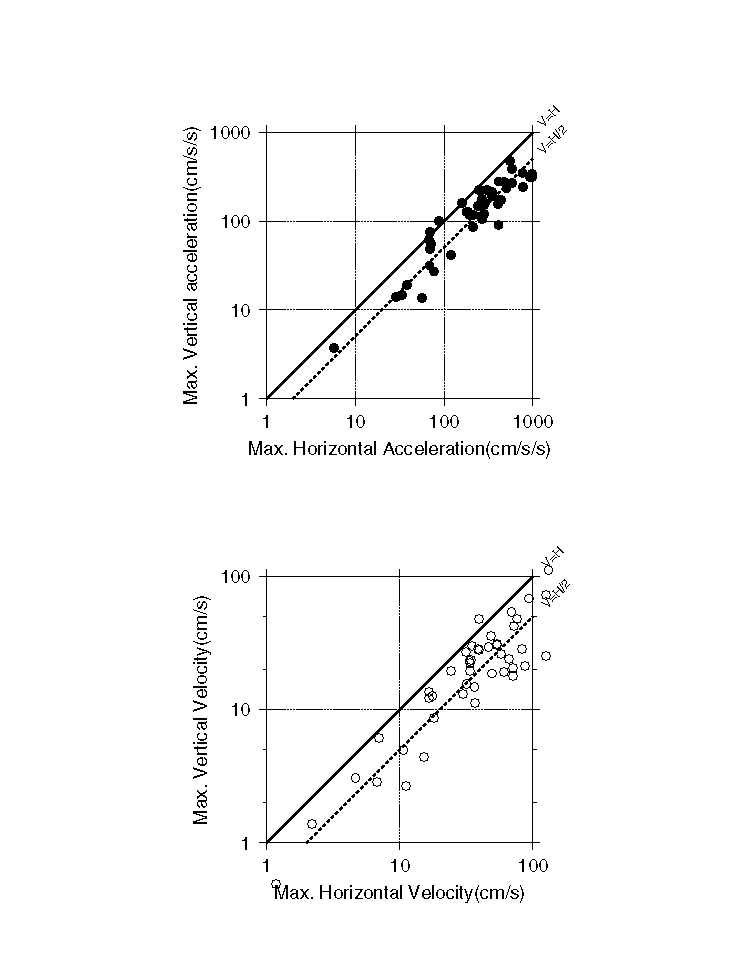
Comparison bet. H and V of max. acc. and velocity
h
Seismic intensity distribution. Black Stations are JMA seismic intensity from
released waveform data (data by CWB and Dr. Lee)
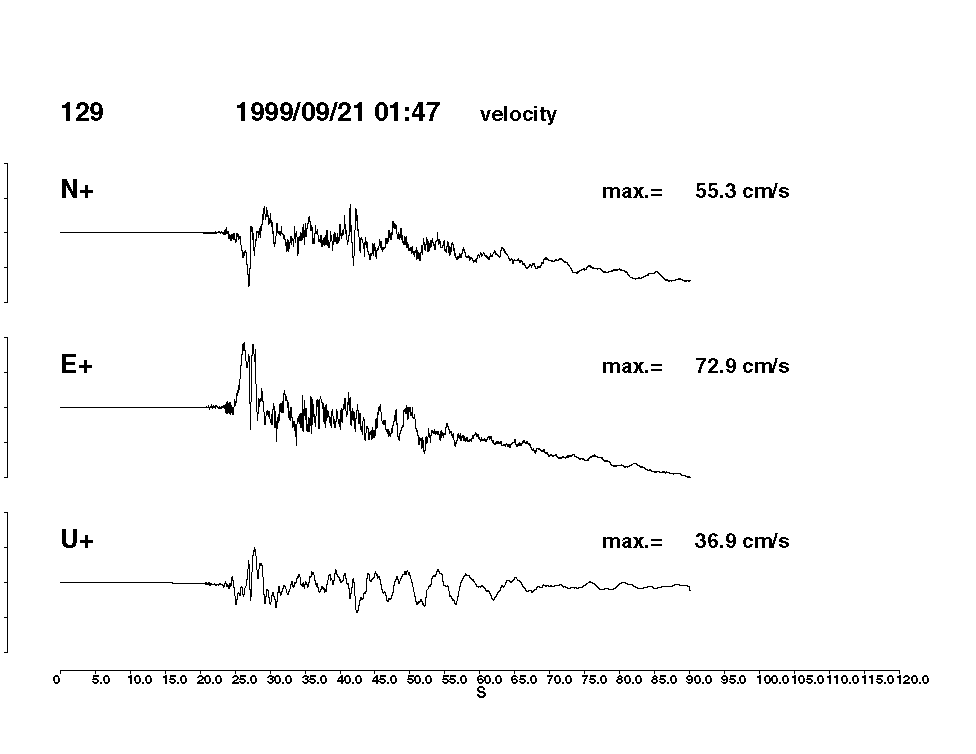
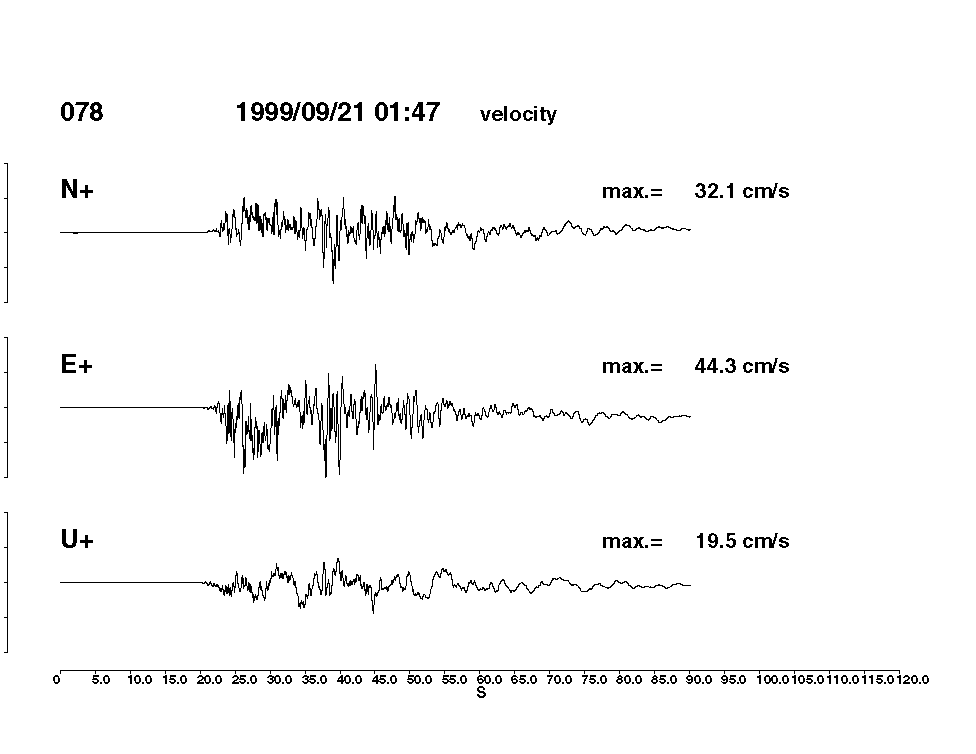
Waveforms at TUC129 and TUC078
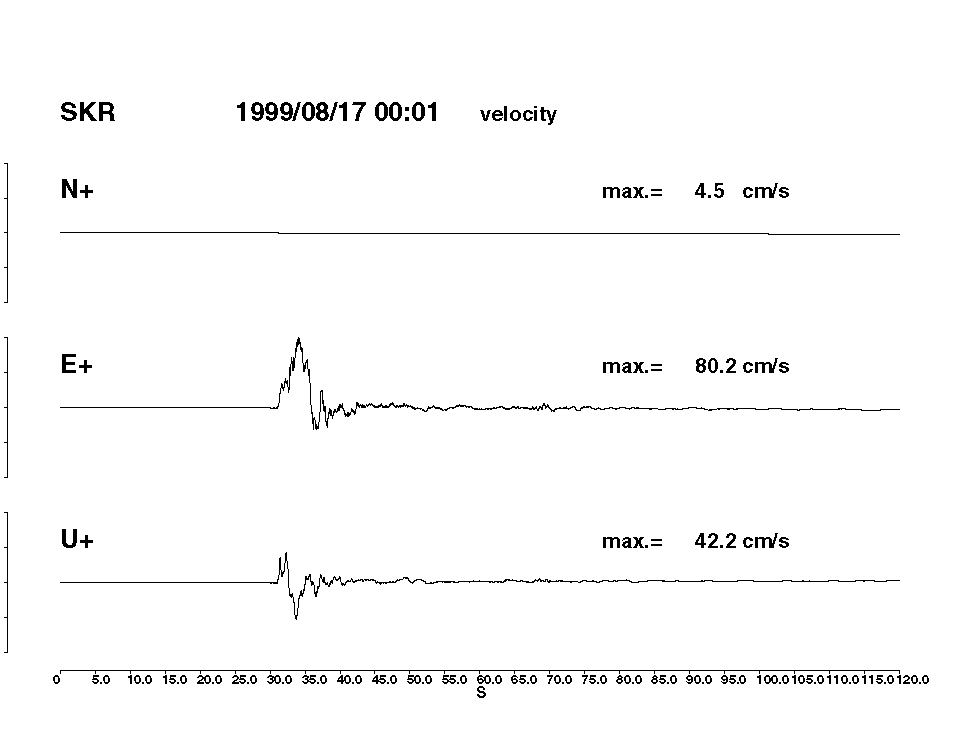
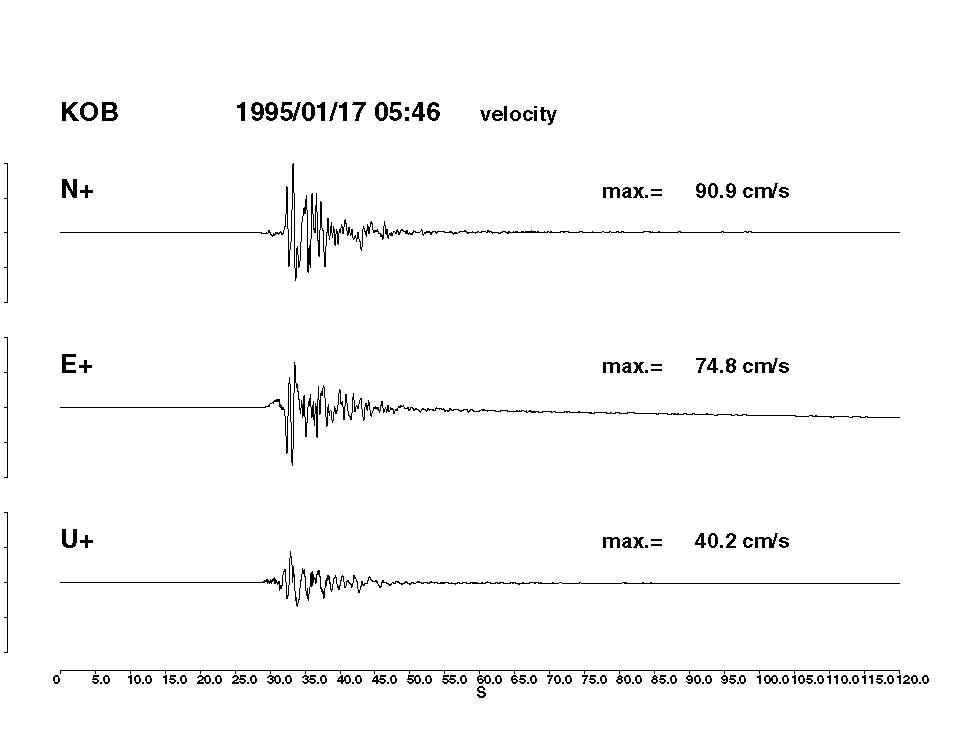
WIth comparing Kobe-JMA and Kocaeli-SKR data
acknowledgement for Seismology Center, Central Weather Bureau, Taipei, Taiwan,
Deprem, Turkey, and JMA.
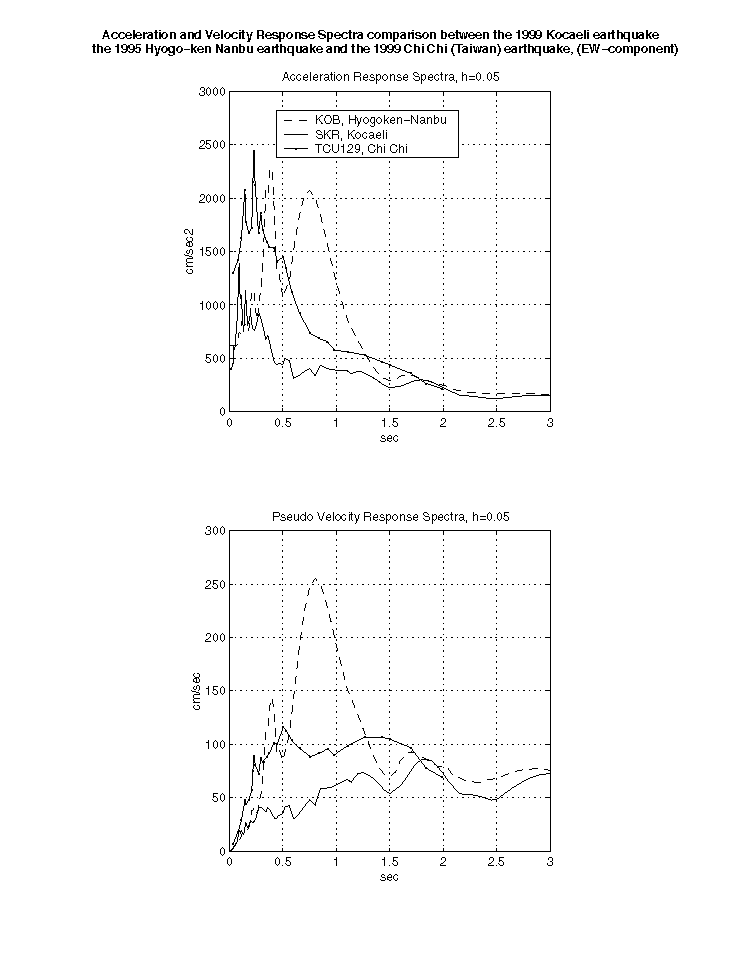
Comparison between acceleration response spectra (and pesudo velocity spectra) of TUC129, KOB and SKR. All are EW-components.
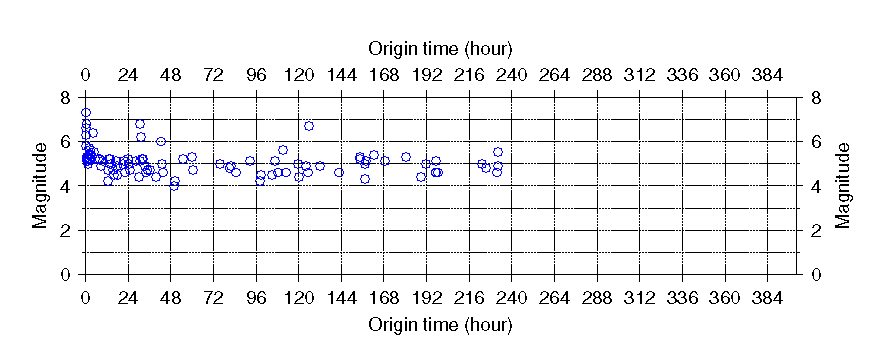
M-T diagram. data from CWB homepage.ˇĘˇ©ˇË
Epicenter distribution
Epicenter distribution. Lighter blue color shows shallower events.
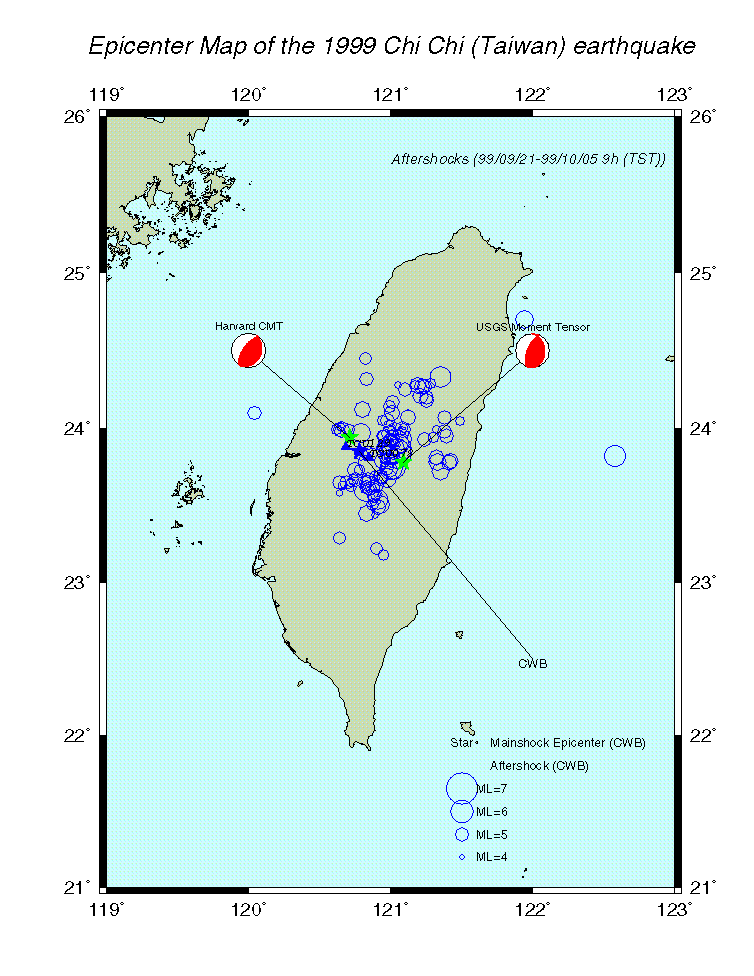
Map of Epicenter information
Blue circles show epicenters of aftershocks determined by CWB (Taiwan Central Weather Beaureau)

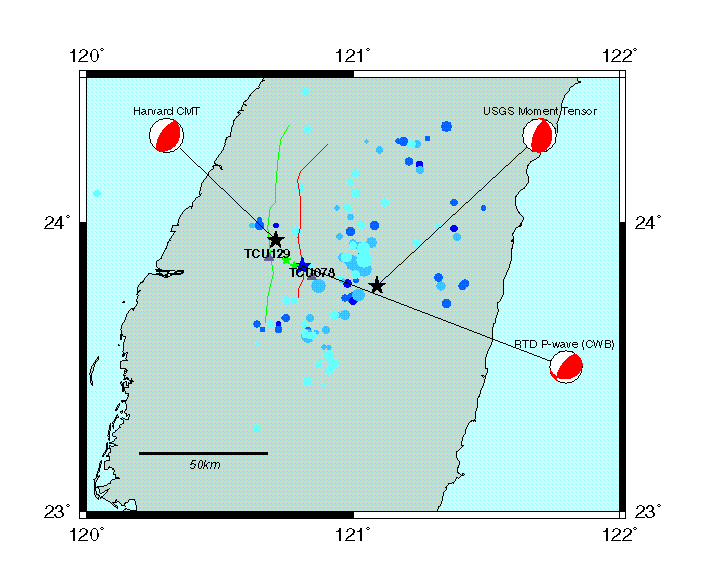
Map of Epicenter information 2
Blue dots show epicenters of aftershocks determined by CWB (Taiwan Central Weather Beaureau). Lighter color shows shallower events.
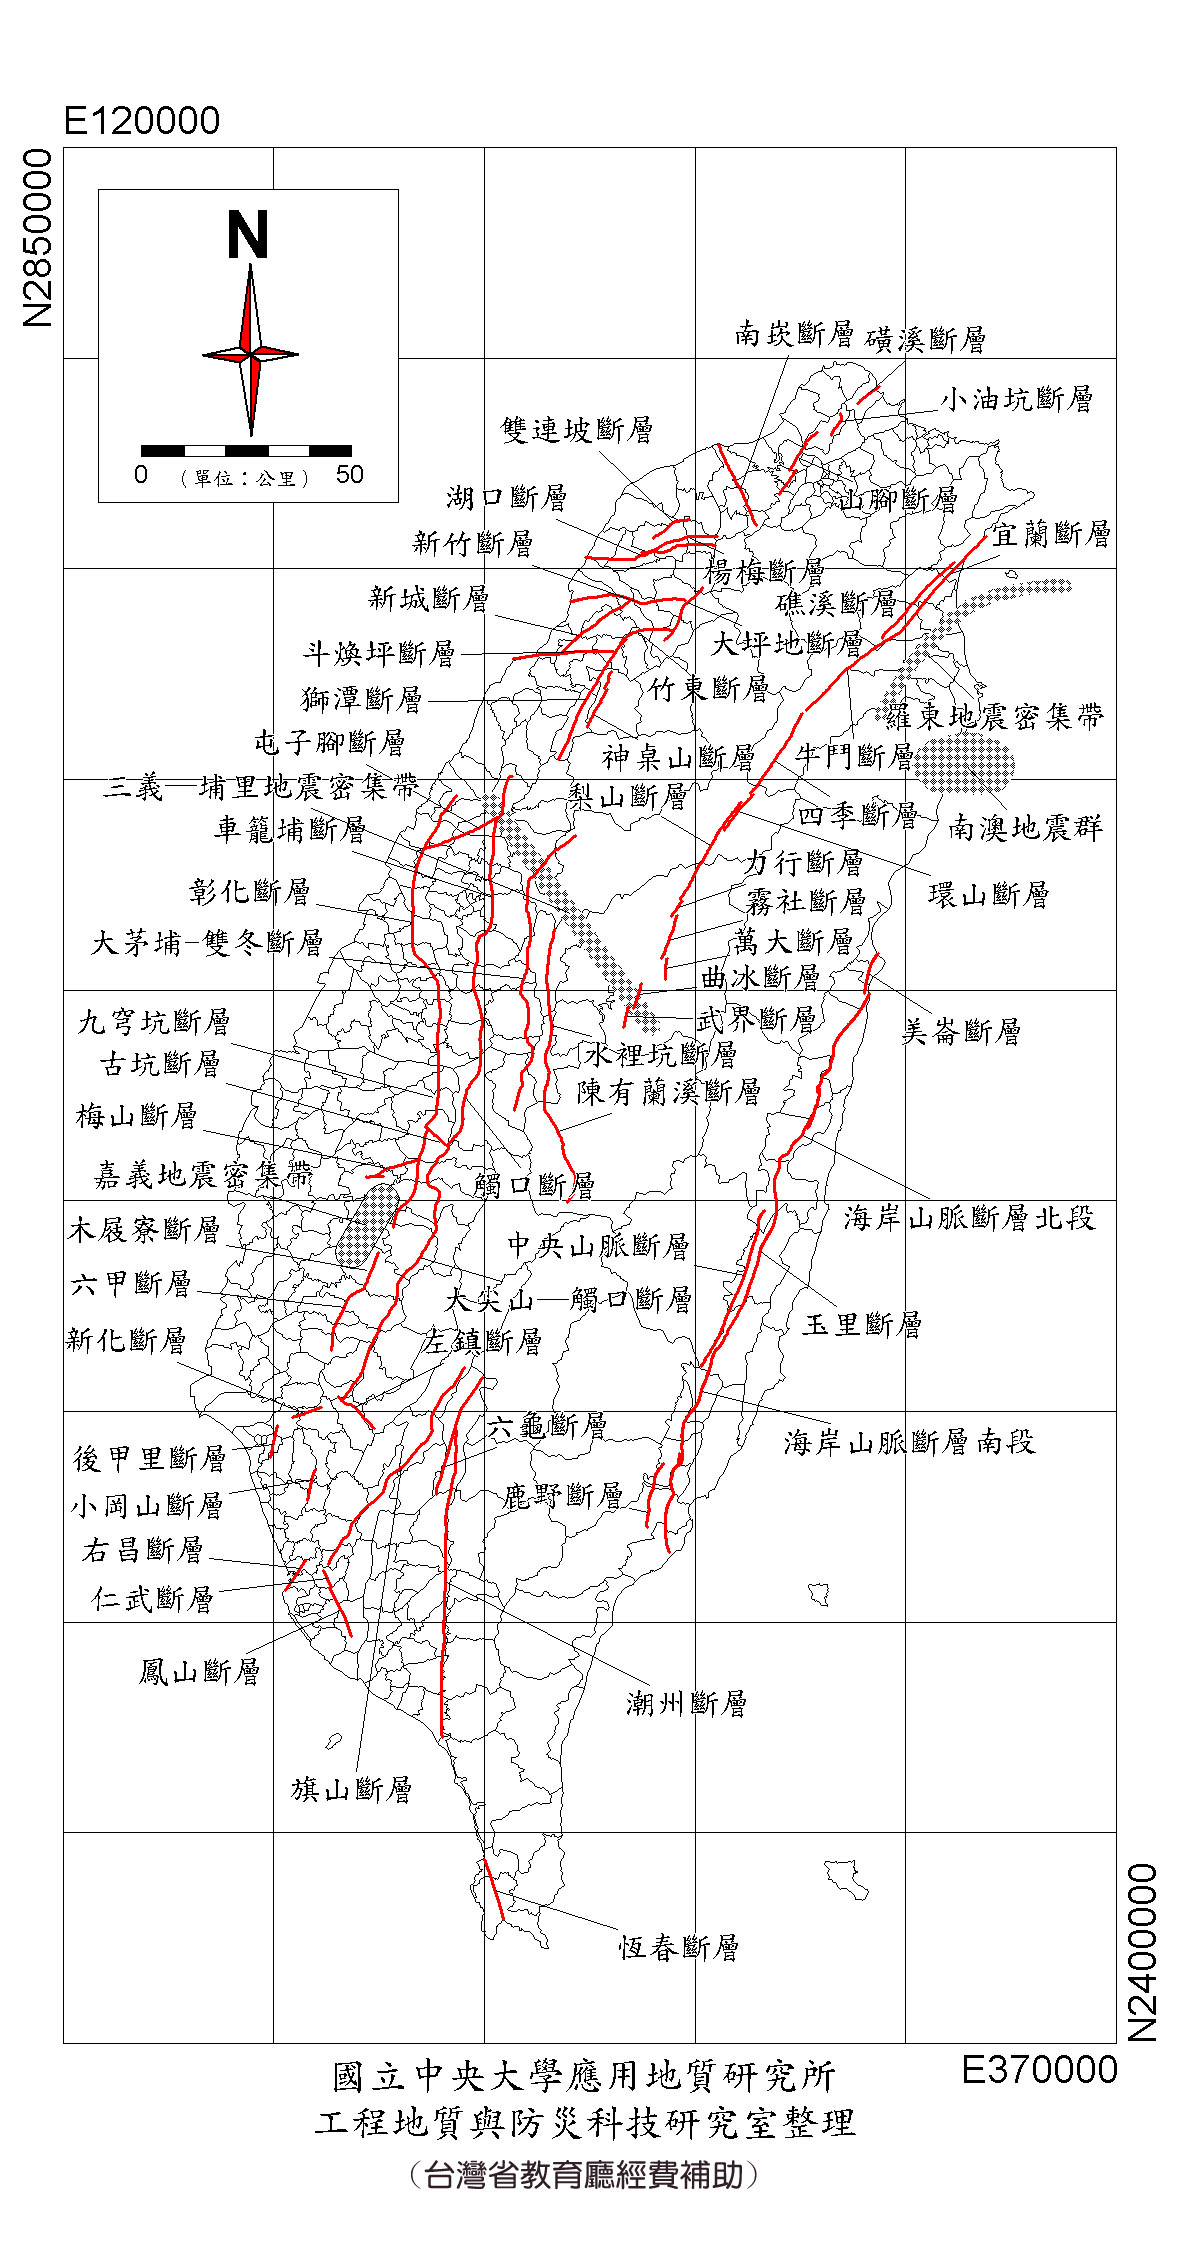
Map of Active faults
M-t figures
Map of Seismic Intensity (Information from Prof. Wen and added JMA intensity (TCU078&129)

Response spectra
CAUTION
PSA (Pseudo Acc. Response Spectra):KOB and SKR
Sa (Acc. Response Spectra) :TCU129
&
PGV: KOB, SKR and TCU129
TCU129 and TCU078 waveforms integrated from acc. data distributed by Lee.
Integration procedure: remove offset before P-wave arrival
time domain integration
TCU129
TCU078
Comparison between near-source ground motions
Maximum acceleration distribution. Triangles show the station whose
max. value information were released.
Max value means the maximum value
of three component maximum values. Contours corrspond seismic intensity boundary.
Comparison bet. max. acc. of three components. Yellow dots show the Chelongpu
fault (The earthquake occurred mainly on the active Chelongpu fault.).


Comparison bet. max. vel. of three components. Yellow dots show the Chelongpu
fault (The earthquake occurred mainly on the active Chelongpu fault.).


Comparison bet. max. disp. of three components. Yellow dots show the Chelongpu
fault (The earthquake occurred mainly on the active Chelongpu fault.).


Comparison bet. vertical and horizontal (larger values of EW and NS comp) compo\
nents of acceleration and velocity.